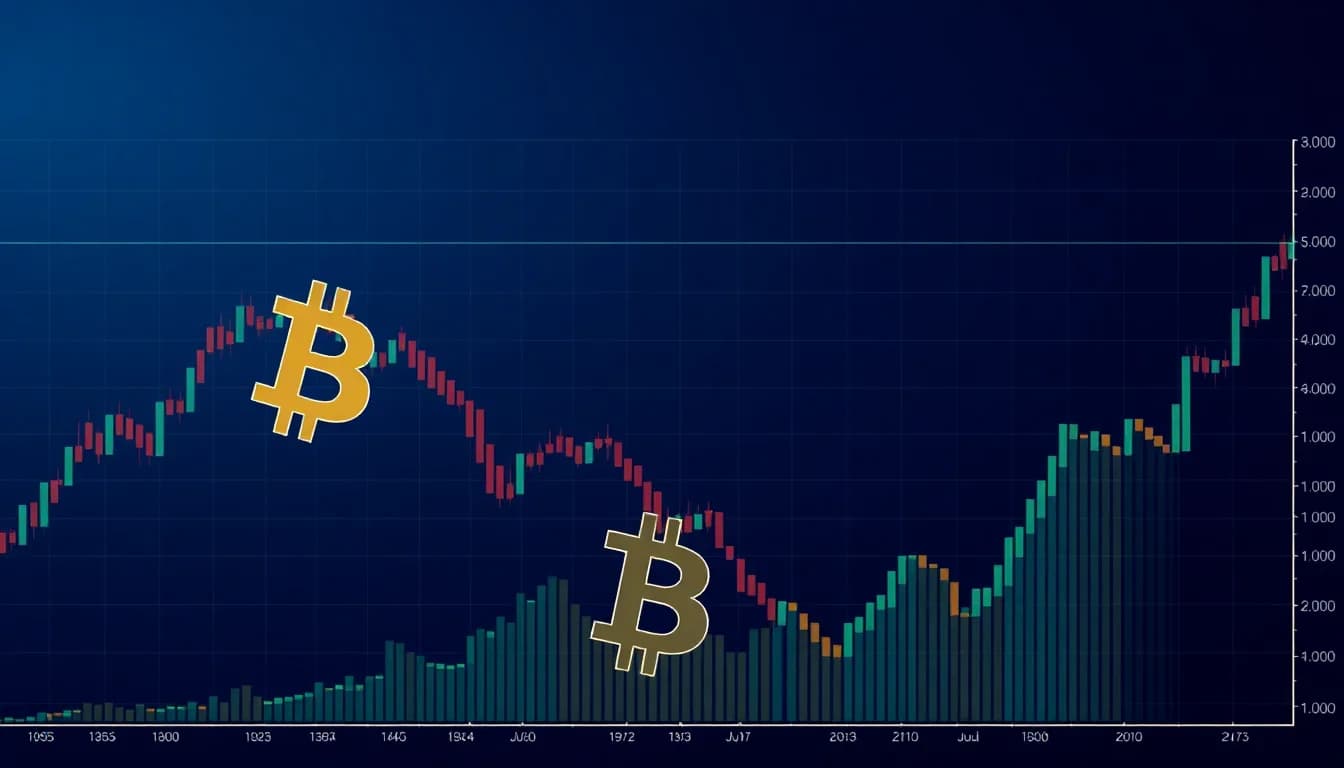
Analysts have identified a bearish "Bart Simpson" pattern in Bitcoin's chart, indicating potential downward movement amid mixed market signals.
Analysts are observing a bearish trend in Bitcoin's price chart, specifically identifying a "Bart Simpson" pattern that suggests potential downward movement. Benjamin Cowen highlighted this formation, which is characterized by a sharp price spike followed by a brief sideways movement and a rapid return to the original price level.
For this pattern to play out, Bitcoin would need to experience a notable correction, possibly dropping around 20% from its recent highs. Mati Greenspan, founder of Quantum Economics, noted that while this scenario is plausible, it is not highly likely given the current market conditions. He pointed out that such price dynamics were more common in Bitcoin's earlier, less liquid days.
Current Market Position
As of now, Bitcoin is trading at approximately $77,700, down 0.3% in the last 24 hours and 1.3% over the week. After exceeding $80,000 in August, Bitcoin has struggled to maintain these levels, with analysts noting key support and resistance zones. Significant support is identified between $62,000 and $65,000, while resistance is seen in the $83,000 to $86,000 range.
Additionally, the percentage of profitable Bitcoin holdings is on the rise, with 68% of the supply being profitable by the end of August compared to 65% in May. This increase could exert additional pressure on prices.
However, not all indicators are pointing to a bearish outlook. CryptoQuant recently reported that Bitcoin Cycle Momentum has entered a positive phase for the first time in eight months, suggesting a potential shift away from the current downtrend. Analysts indicate that for a confirmed reversal, the momentum needs to rise significantly in the coming weeks.
Institutional Trends and Market Influences
The institutional market shows a mixed picture as well. Glassnode reported that the average daily inflow into U.S. spot Bitcoin ETFs reached $290 million, yet trading volumes have remained lower than during periods of steady growth. The options market reflects cautious sentiment, with the 25-Delta Skew returning to neutral.
As of late September, open interest in options on platforms like Deribit and IBIT is around $14 billion, primarily focused on strikes above $80,000. Furthermore, rising yields in the U.S. Treasury market, now at 4.8%, have added pressure on risk assets like Bitcoin, especially following comments from Federal Reserve Chair Kevin Warsh that coincided with a drop in Bitcoin's price from a recent high of $81,455.