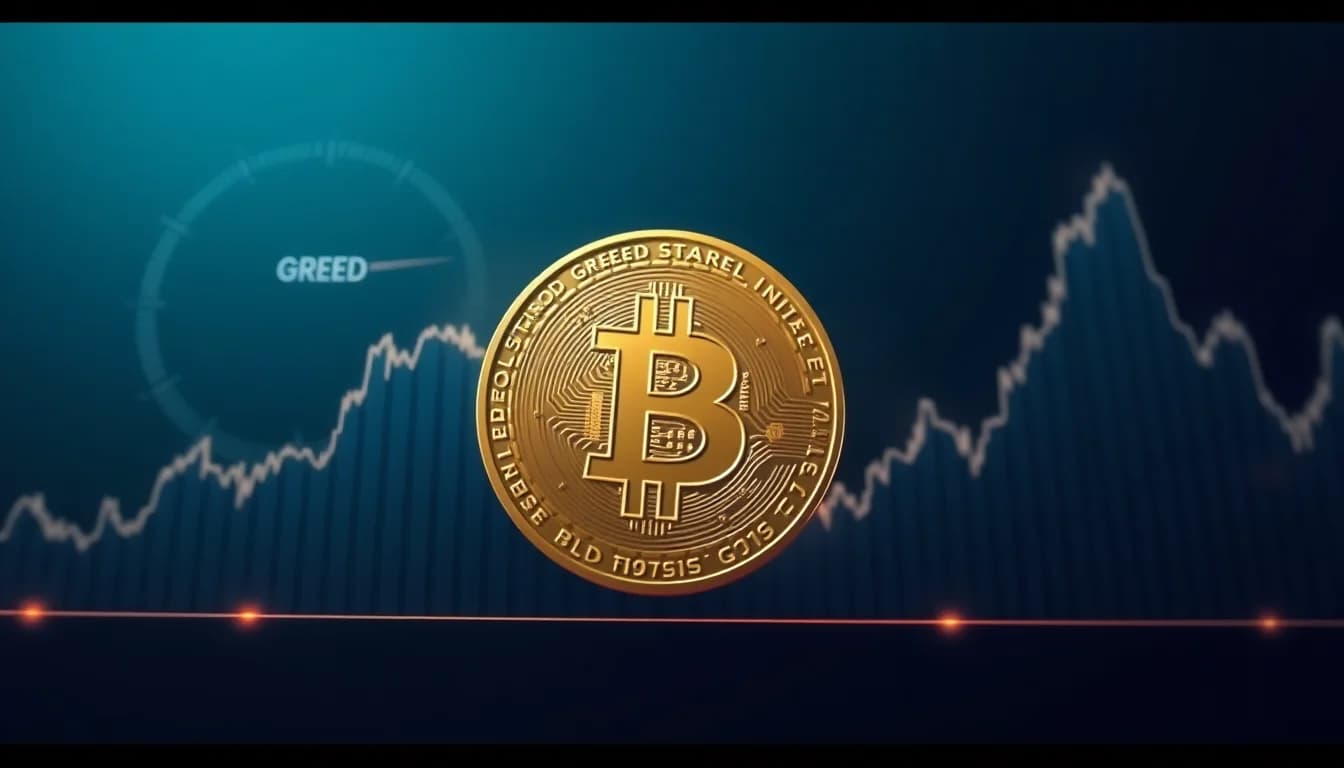
On January 15, a popular market sentiment indicator showed "greed" for Bitcoin investors for the first time since October. The index reached 61 after a prolonged period of "fear" and a cascade of liquidations totaling $19 billion.
The day before, the indicator was in neutral territory at 48.
The improvement in sentiment coincided with a recovery in the price of the leading cryptocurrency. Bitcoin rose to $97,704, its highest level in two months (according to CoinGecko). The last time it surpassed $97,000 was in mid-November, when the market was experiencing "extreme fear" due to a sharp pullback from historical highs.
Analysts at Santiment noted a departure of retail investors from the asset. Over three days, the number of addresses with a non-zero balance decreased by 47,244.
🥳 Bitcoin has roared back to a 2-month high of $97.5K. Over the past 3 days, there is a net drop of -47,244 holders, indicating that retail had been dropping out due to FUD & impatience. This price bounce has also been supported by a 7-month low 1.18M $BTC on exchanges. 👍 pic.twitter.com/KtoRIBgChy
— Santiment (@santimentfeed) January 14, 2026
Experts described the exit of the "impatient crowd" and the drop in exchange supply to a seven-month low (1.18 million BTC) as a bullish signal.
Heading Back to $100,000
According to Santiment, the prevailing pessimism on social media could fuel a rally to new all-time highs.
😒 According to social data, the commentary toward Bitcoin across social media has interestingly turned more and more bearish as prices have bounced this week. With markets typically moving the opposite direction of retail sentiment, the most FUD seen in 10 days may propel $BTC… pic.twitter.com/BbcFai1Sd5
— Santiment (@santimentfeed) January 15, 2026
While Bitcoin's price is recovering, user comments are becoming increasingly "bearish".
Typically, the market moves against the crowd's expectations. Currently, fear, uncertainty, and doubt metrics have peaked in the last 10 days.
According to Santiment, this atmosphere of distrust creates ideal conditions for growth, potentially bringing the price back to $100,000 for the first time since mid-November.
Fundamental Market Strength
The current growth is based on on-chain metrics rather than speculation, according to CryptoQuant analyst Carmelo Aleman.
Bitcoin Breaks Resistance as Holders Refuse to Sell
— CryptoQuant.com (@cryptoquant_com) January 15, 2026
“Historically, when Bitcoin’s price rises while VDD remains low, the market tends to be in a healthy expansion phase, where demand absorbs the available supply without generating structural selling pressure.” – By @oro_crypto pic.twitter.com/soss3JTgU0
The expert pointed to the dynamics of the Value Days Destroyed (VDD) indicator. This metric assesses coin movement activity, weighing it by volume and time inactive. High values indicate the spending of older coins, while low values indicate the circulation of recently purchased assets.
In January 2026, the VDD metric dropped to 0.53, a historically low level indicating that primarily "young" coins are moving in the network.
Long-term holders are refraining from taking profits despite rising prices. The market is in a phase of healthy accumulation: demand absorbs supply without encountering selling pressure from "old" capital.
Aleman emphasized that the current breakout is driven by real market strength. The situation will remain favorable as long as VDD stays low. A sustained increase in the metric would signal the start of asset sell-offs by long-term investors.
Global Derivatives Deleveraging
A 31% drop in open interest (OI) in Bitcoin derivatives since October indicates a significant "cleaning" of the market from excessive leverage. This could signal a price recovery, according to CryptoQuant analyst Darkfost.
Deleveraging signal as BTC OI drops by 31%
— CryptoQuant.com (@cryptoquant_com) January 14, 2026
“Historically, they have often marked significant bottoms, effectively resetting the market and creating a stronger base for a potential bullish recovery.” – By @Darkfost_Coc pic.twitter.com/JkYoKfg4Ql
He noted that reducing leverage has historically marked market bottoms. This process "resets" the market structure, creating a foundation for a potential bullish trend.
The expert added that if Bitcoin continues to decline, OI could drop even further, indicating a deeper correction. However, the current dynamics suggest a positive scenario.
Why This Matters
Price increases amid declining open interest typically indicate forced or voluntary closures of short positions (short squeeze). Traders betting on declines are realizing losses and exiting the market, reducing selling pressure.
In this case, the rally is fueled by real spot purchases rather than speculative capital. Since the beginning of the year, Bitcoin has risen nearly 10%, confirming the trend's resilience.
According to CoinGlass, the total OI across all exchanges is now around $65 billion. This is 28% lower than the peak in early October ($90 billion), aligning with CryptoQuant's calculations.
Optimism remains in the options market. On Deribit, the maximum volume of positions is concentrated at the $100,000 strike, as traders bet on further growth.
Despite the optimism, the derivatives segment has not yet transitioned into a full growth phase, noted Greeks Live.
Bitcoin successfully broke through the $9,5000 resistance level, breaking out of its nearly two-month consolidation range. Since falling below this key threshold in mid-November, Bitcoin had been trading sideways at lower levels.
— Greeks.live (@GreeksLive) January 14, 2026
Ethereum saw a larger percentage gain but its… pic.twitter.com/zl0YOIGhIk
"The current trading structure resembles a reaction to a sudden price spike; long-term prospects have not yet shifted toward a bull market," analysts noted.
It is worth mentioning that Glassnode reported that institutions have resumed Bitcoin purchases amid the risk of explosive volatility.